Gold · Gold Education
The Gold Paradox: Why Interest Rates Move Gold — Except When They Don't
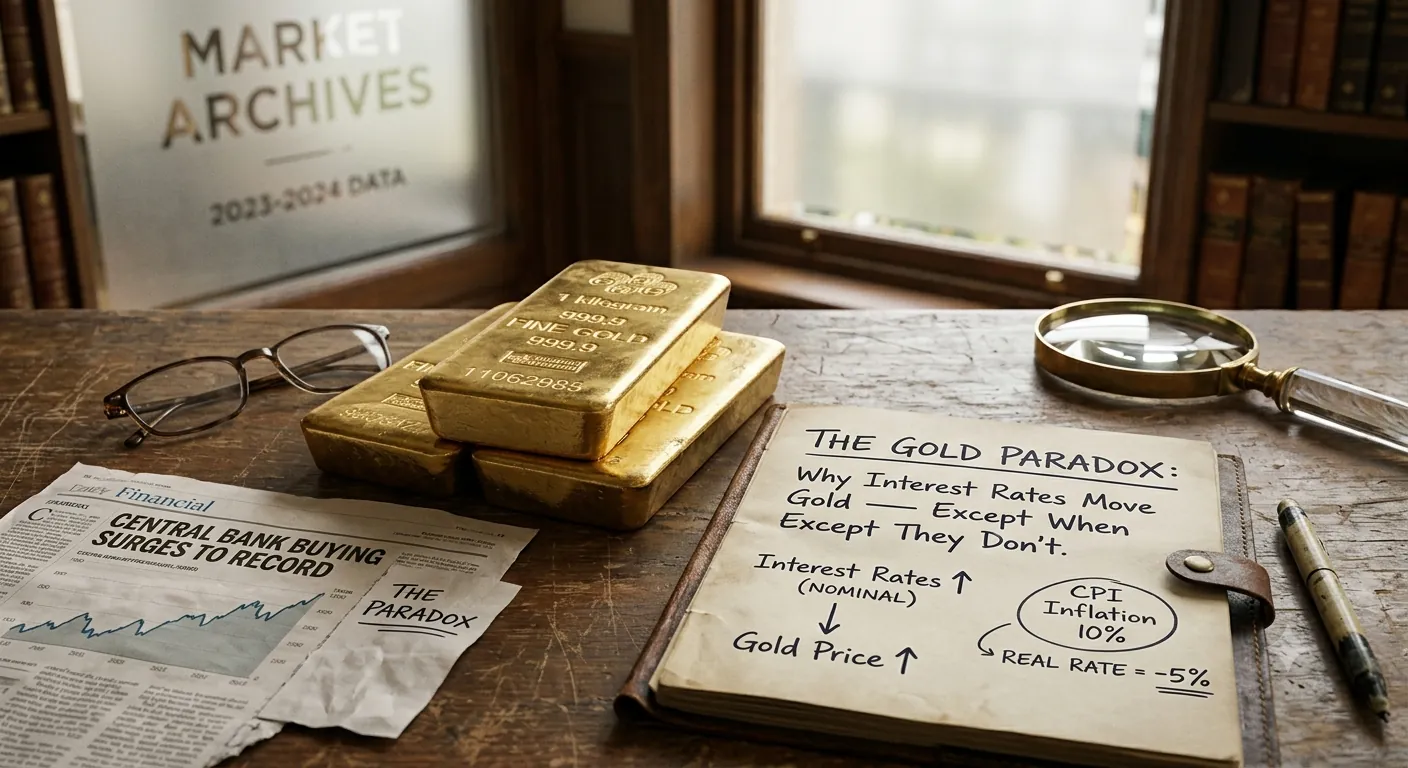
A Puzzle That Broke the Textbook
In 2022, the Federal Reserve did something it hadn't done in more than forty years: it raised interest rates at the fastest pace since Paul Volcker's inflation-fighting campaign of the early 1980s. Within months, the interest rate on inflation-protected Treasury bonds — the closest thing markets have to a "true" cost of money — swung from roughly negative 1% to positive 1.5%. Every model, every textbook, every rule of thumb said the same thing: gold should fall hard.
It didn't. Gold spent 2022 holding stubbornly near $1,800 an ounce. Then, rather than finally rolling over in 2023 as real interest rates stayed elevated, gold pushed toward new record highs instead. By late 2025 it had climbed past $4,380 an ounce — a level nobody's rate model would have predicted from where real yields stood.
This is not a story about gold breaking its relationship with interest rates. It's a story about that relationship being real, powerful, and still not being the whole story. To understand why gold did the "wrong" thing in 2022, you first have to understand why interest rates move gold at all — and that starts with the single strangest fact about the metal.
The Simplest Fact About Gold
Gold pays nothing. Own a bond, and you collect interest. Own a stock, and you might collect a dividend. Own a savings account, and the bank pays you for the privilege of holding your money. Own an ounce of gold, and it just sits there — the same ounce, indefinitely, generating no income at all. If anything, it costs money to store and insure it.
That single fact is the entire starting point. Economists call the income you give up by choosing one asset over another its opportunity cost, and for gold, that cost is set almost entirely by what you could otherwise earn holding something safe, like a government bond. When interest rates rise, bonds start paying more, and the income an investor forgoes by holding gold instead grows larger. Gold doesn't get worse — the alternative just gets more attractive. When rates fall, the opposite happens: the income sacrificed by holding gold shrinks, and gold's zero yield stops looking like such a disadvantage.
This is the whole mechanism, in one sentence: gold competes with yield, and interest rates set the price of yield.
It's Not the Rate You Hear About on the News
Here's where most explanations go wrong. The interest rate that actually matters to gold isn't the headline number a central bank announces — it's that number minus inflation, known as the real interest rate. A bond paying 5% sounds appealing, but if inflation is running at 6%, the buyer is losing purchasing power every year despite collecting interest. In that environment, gold's lack of yield is a much smaller disadvantage than the 5% headline rate would suggest, because the interest-bearing alternative isn't actually preserving value either.
This distinction isn't a minor technicality — it's the whole ballgame. Financial economists Claude Erb and Campbell Harvey, in widely cited research on gold pricing, calculated the correlation between real interest rates and the price of gold at roughly -0.82 — one of the strongest relationships found anywhere in financial markets. Separately, the asset manager PIMCO ran its own analysis of gold prices against real 10-year Treasury yields going back to 2004, when gold first became an easily tradable financial asset through exchange-traded funds. Their finding: a one-percentage-point rise in real 10-year yields has historically been associated with an 18% decline in gold's inflation-adjusted price — a relationship strong enough that PIMCO describes gold as behaving like a bond with an effective duration of eighteen years.
That number is worth sitting with. It means gold, an asset with no maturity date and no coupon, moves with the sensitivity of a very long-dated bond — just in response to real interest rates instead of nominal ones.
History's Verdict: Seven Rate-Hiking Cycles, Seven Different Outcomes
The clearest way to test the real-rate mechanism isn't a formula — it's history. And when you actually line up every major Federal Reserve rate-hiking cycle since the early 1980s against what gold did during each one, the honest picture is messier, and more interesting, than a textbook chart would suggest.
The first came in the 1970s. The U.S. had just severed the dollar's link to gold in 1971, freeing the metal to trade openly for the first time in decades. What followed was a decade of oil shocks, double-digit inflation, and a Federal Reserve that consistently let interest rates lag behind rising prices — pushing real interest rates deeply negative for years. Gold, worth around $35 an ounce when it was set free, spiraled to $850 an ounce by January 1980.
Then Paul Volcker's Fed reversed course violently, pushing the federal funds rate to 20% in 1981 — a record that still stands. Real interest rates snapped sharply positive, and gold collapsed from $850 to under $400 within two years, eventually grinding down to $252 by 1999. Two hiking cycles followed in the 1980s alone — 1983–84 and 1988–89 — and gold fell in both, down 29% and 12% respectively, exactly as the opportunity-cost mechanism would predict.
But then the pattern gets far less tidy. During the Fed's 1994–95 hiking cycle — rates nearly doubled from 3% to 6% — gold barely moved at all. The 1999–2000 cycle was similarly indecisive. And then came the 2004–2006 cycle, which should have been straightforward: the Fed hiked steadily from 1% all the way to 5.25%. Gold didn't fall. It rose 88%, from $396 to $744, driven by a separate story entirely — a surge in energy prices reshaping inflation expectations at the same time rates were rising. The 2015–2018 hiking cycle told a similar story: rates rose from near-zero to 2.5%, and gold still gained roughly 24% over the period.
Use the chart below to see all seven cycles side by side, with the exact dates and numbers behind each one.
Hover or tap a bar for details
Gold’s price change during each of the last seven major Federal Reserve rate-hiking cycles, 1983–2023. All cycles shown were periods of rising interest rates — note that gold’s reaction varied enormously, from a 29% decline to an 88% gain, underscoring that rate direction alone does not determine gold’s response.
Then the Rule Broke — On Purpose
Which brings us back to the most recent hiking cycle, and the puzzle from the opening of this piece. The 2022–2023 cycle actually split into two distinct phases, and the gap between them is the whole lesson. In the first phase — March through November 2022, as the Fed hiked at its fastest pace since the Volcker era and real yields swung from roughly -1% to +1.5% — gold behaved exactly as the textbook predicts: it fell from about $2,050 to around $1,630, a decline of roughly 20%. The mechanism worked, on schedule. Then, in the second phase, something changed. Even as the Fed held rates at their peak of 5.25–5.50% through most of 2023 and 2024, gold stopped falling and started climbing — eventually pushing past $4,380 by late 2025, far beyond anything the rate-driven model alone would explain.
The explanation shows up in the data on who was actually buying. According to the World Gold Council, central banks purchased over 1,000 tonnes of gold in 2022 alone — the highest level of official-sector buying since 1950 — and kept buying at a similar pace through 2023 and 2024. For comparison, the average annual pace of central bank gold buying between 2010 and 2021 had been roughly 470 tonnes. Central banks had nearly doubled their accumulation rate almost overnight, and that new demand simply didn't care what real yields were doing.
Crucially, central banks aren't buying gold for yield — they're buying it for reasons that have nothing to do with the opportunity-cost math this article opened with: diversifying reserves away from the U.S. dollar, hedging against geopolitical and sanctions risk, and reassessing what counts as a genuinely safe long-term store of value in an increasingly fractured world. As one analysis from Janus Henderson put it, the traditional relationship between gold and real yields hasn't been repealed so much as it's now operating from a permanently higher floor — real yields still push gold up and down at the margin, but a large and growing base of structural, rate-insensitive demand now sits underneath the whole system.
That's the resolution to the paradox. The mechanism connecting interest rates to gold is still intact — the second phase of the 2022 cycle didn't disprove it. It's just no longer the only force setting the price, and in recent years it hasn't even been the dominant one.
Where Things Stand Right Now
This tension between the classic mechanism and the newer structural demand isn't a historical curiosity — it's the exact dynamic playing out in gold markets today. As of late July 2026, the real yield on 10-year Treasury Inflation-Protected Securities has been trading above 2% — among its highest levels since before the pandemic, and well above its own ten-year average of roughly 0.9%. Under the textbook relationship described earlier in this piece, that alone should be a serious headwind for gold.
And yet gold has continued trading within reach of its record highs through the same period — the same tension that first opened up in 2022 is still visibly at work. This is precisely why, as the chart above makes clear, a single day's or even a full cycle's gold move can rarely be explained by pointing at interest rates alone, and why the daily analysis on this site consistently traces a fuller chain: what changed in rates, what changed in the dollar, what changed in central bank or safe-haven demand, and how those forces net out on a given day. The mechanism in this article is the foundation — but as 2022 through today has shown, it's a foundation other forces can now build on top of, not the only structure left standing.
The Short Version
Gold pays no yield, so its appeal is set by opportunity cost — what an investor gives up by not holding a bond instead. Rising rates raise that cost; falling rates lower it.
Real interest rates (nominal rates minus inflation) drive gold far more reliably than the nominal, headline rate. Research from Erb and Harvey puts the long-run correlation at roughly -0.82.
But "rates up, gold down" is not a reliable rule on its own. Of the last seven major Fed hiking cycles since 1983, gold fell in three, was roughly flat in two, and rose in two — including an 88% gain during the 2004–2006 hiking cycle. Other forces (energy prices, the dollar, central bank demand, safe-haven flows) regularly overwhelm the rate effect.
The 2022–2023 cycle shows both sides in one story: gold fell about 20% in the first eight months as the mechanism predicted, then rose to record highs over the following two years as record central bank buying — over 1,000 tonnes a year, roughly double the prior decade's pace — added a large, rate-insensitive source of demand.
As of today, real yields are elevated and gold is near record highs simultaneously — the same tension visible throughout this history. Understanding gold requires tracing the full chain of forces at work in a given period, not applying the rate relationship as a fixed rule.
Sources
- Claude B. Erb and Campbell R. Harvey — research on gold as an investment asset, cited via LongTermTrends analysis of real yields and gold
- Goldmoney Research — "Rate Hikes and What It Means for Gold," historical analysis of Fed hiking cycles and gold performance
- World Gold Council — Gold Demand Trends, central bank purchase data, 2022–2025
- Janus Henderson Investors — analysis of the gold / real-yield divergence since 2022
- T. Rowe Price — "What Is Driving Gold Prices to All-Time Record Highs?"
- Federal Reserve History — Paul Volcker's anti-inflation policy, 1979–1981; FOMC rate-change chronology, 1994–2023
- U.S. Treasury — Daily Par Real Yield Curve Rates (TIPS), July 2026
- Historical Federal Reserve rate-cycle dates cross-referenced across Reuters, Forbes Advisor, and Investing.com/FXStreet market analysis
This article is provided for informational purposes only and does not constitute investment, financial, or trading advice.